LEAD DISCOVERY PREMIUM
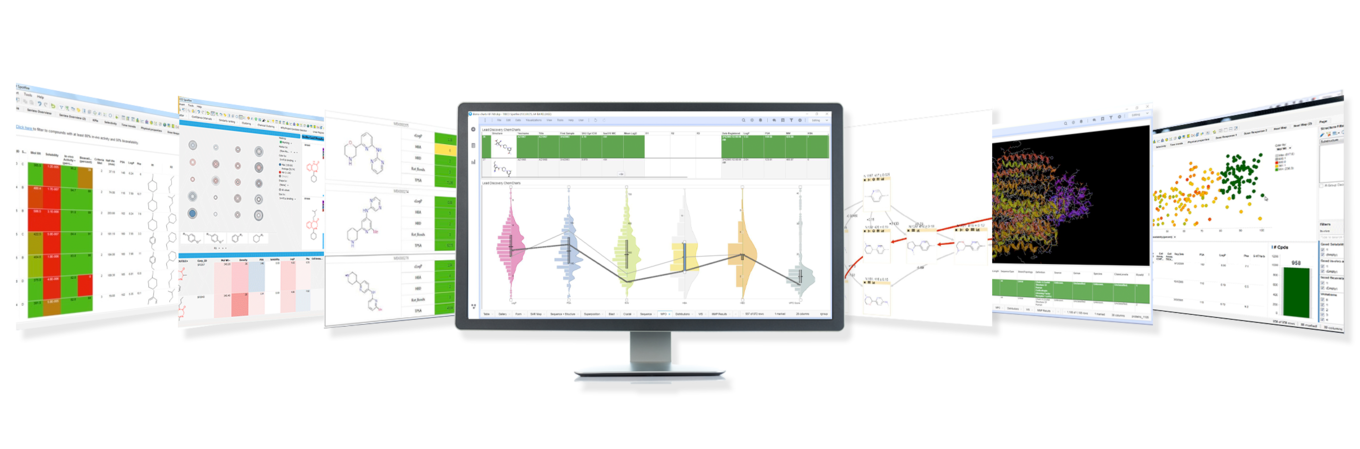
Incisive Chemical and Biological Analytics
When your science is complex, generic business intelligence software doesn’t provide the scientific intelligence you need. Discover Lead Discovery Premium — Analyze and visualize chemical structure & biological sequence data, compare, score, and segment leads based on data-driven multi-parametric optimization. It’s the solution that’s specifically designed for you –the research scientist.
Whether you are a scientist working in drug discovery or materials science, discern and understand the trends and outliers in your data to ensure a successful candidate selection and promotion strategy.
Lead Discovery Premium
Digital Transformation to Accelerate Product Development
CHEMISTRY

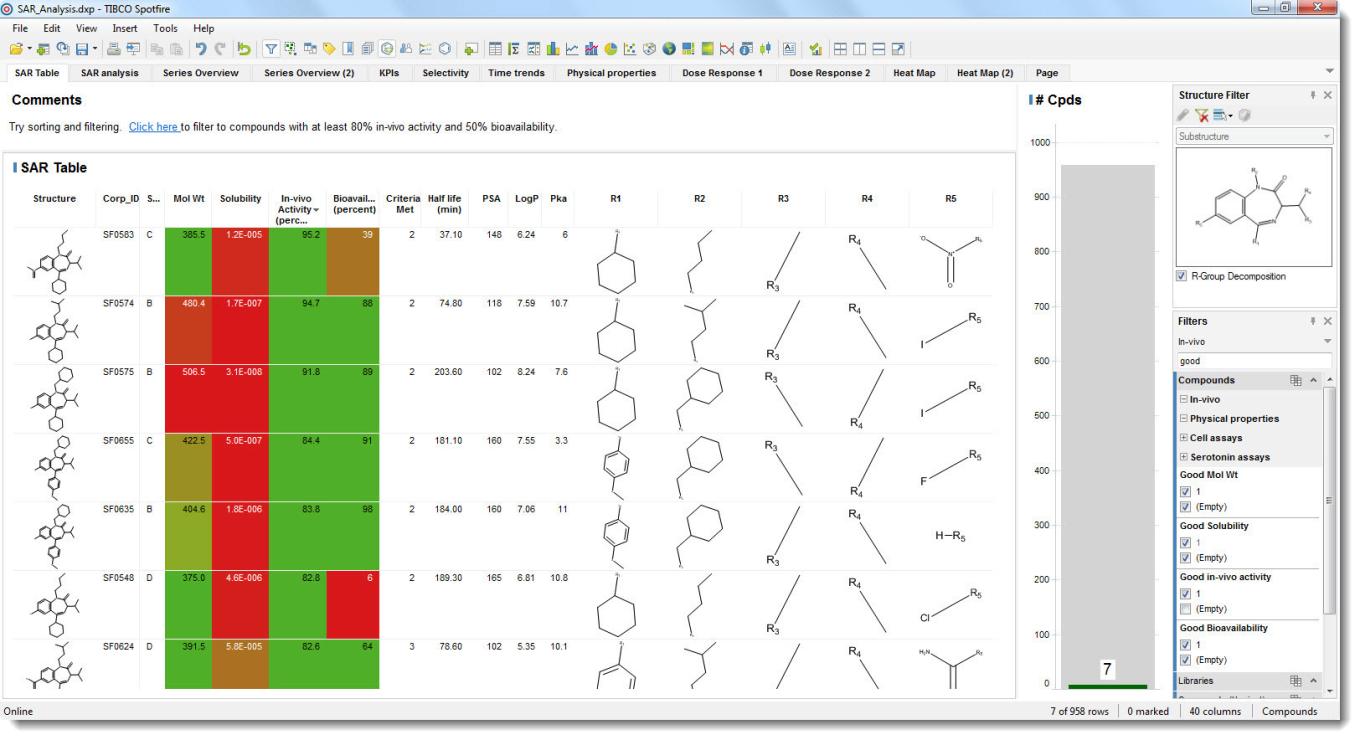
SAR
Structure and Sequence analysis tools in a unified environment

Medicinal Chemistry
Assay results and computational models

Activity Cliffs
Morphology of small and large changes in desired properties
BIOLOGY

Structural Biology
Discover correlations between sequence & observed assay results

Sequence Alignment
Inspect of peptide/nucleotide alignments within Spotfire’s® interactive visual environment
Greater Independence from IT
Advanced SAR tools that used to be reserved for computational chemists and bio-informaticians are now available to bench chemists and assay scientists. Revvity’s Lead Discovery Premium delivers – the combination of Spotfire® based innovative visual analytics and ease of integration with computational services that can have a profoundly positive impact on your science and your business.
Lead Discovery Premium for Small Molecule R&D
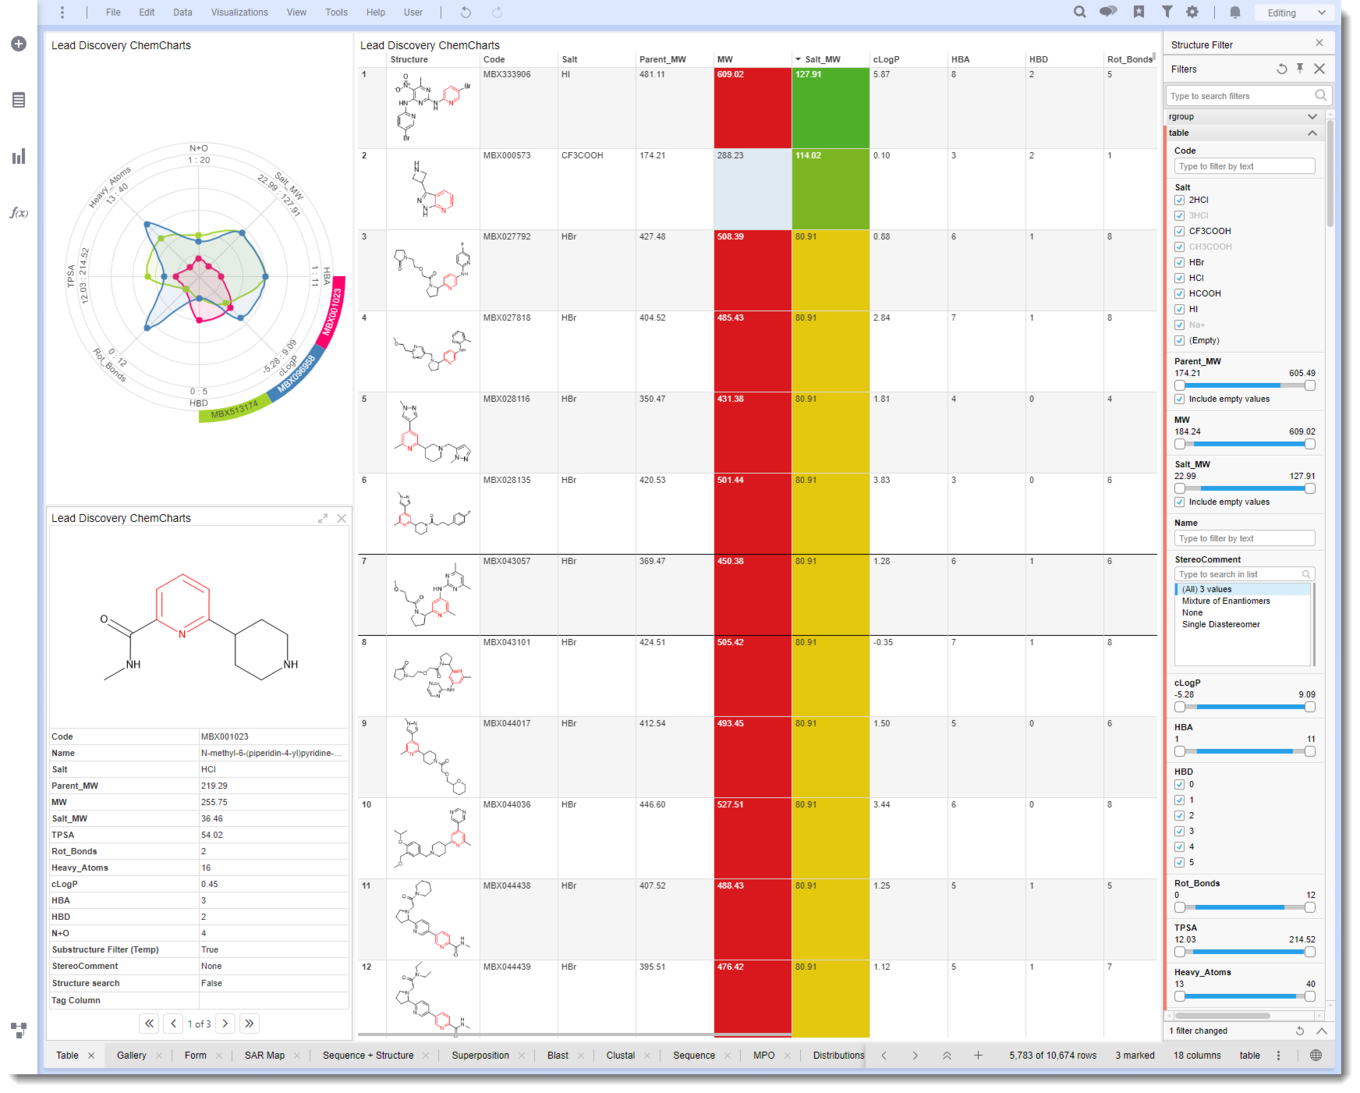
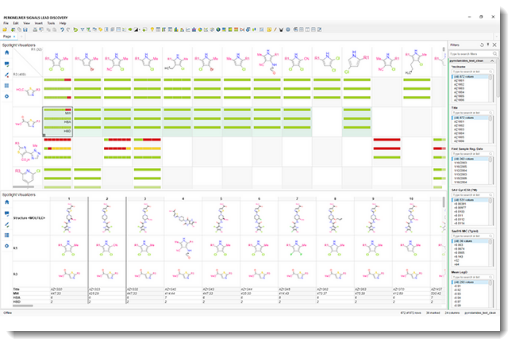
Traditional structure-activity analysis software does not easily adapt to the needs of individual project teams. Lead Discovery Premium’s modular chemistry charts enable teams to deploy purpose built analytic dashboards using Spotfire’s® visual and interactive data exploration capabilities.
Key features include:
- Create reusable guided-analysis applications & dashboards
- User designed Form and Card visualizations
- Highly configurable SAR tables & plots
- Structure filtering with scaffold alignment
- Visual scoring of candidates with radar plots & multi-parameter optimization tools
- R-group decomposition & results visualizations
- Activity Cliff studies
- Neighbor Property Graphs
- Structure Network Navigation
- Match Molecular Pairs filter
- Self-service access to external ChemInformatics computational services & pipelines
- Integration with 3D modeling & design tools


Lead Discovery Premium for Large Molecule R&D
New drug compound modalities and biologics therapies require a new generation of Sequence-activity analysis tools. Lead Discovery Premium is the only platform that integrates sequence visualization, alignment, annotation, and navigation tools together with traditional SAR tools, all within the highly interactive and customizable Spotfire® dashboards.
Key features:
- Native support for viewing & annotating peptide & nucleotide sequences
- Multiple sequence alignment against reference sequences (Clustal Omega)
- Sequence searching (BLAST) support
- Innovated Seq-SAR tool with integrated sequence navigation, violin plots & LOGO plot
- Relate bioactivity to monomer substitutions
- 3-D Structure viewer with integrated sequence navigation tool
- Self-service access to external bio-informatics scripts & computational pipelines
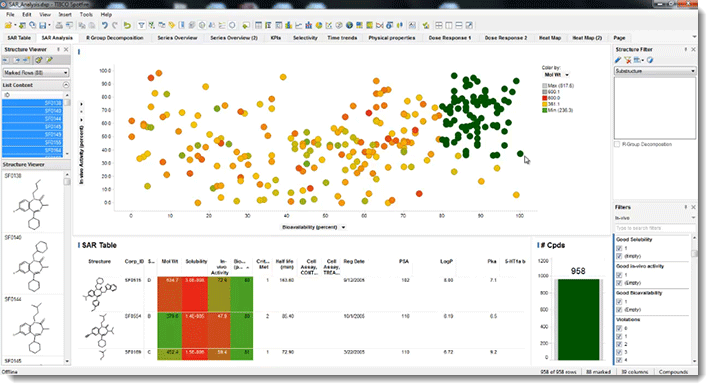
Gain Insights into SAR with Guided Search & Analytics
Wide range of multivariate chemistry data
- Access and display a wide range of multivariate chemistry data sets including chemical structures.
- Access advanced scoring functions to profile compounds.
Load multiple linked chemical and biological data tables in a single analysis file
Facilitate the rapid isolation of promising compounds based on key criteria and chemical structure for further analysis by highly interactive and intuitive visualization and filtering
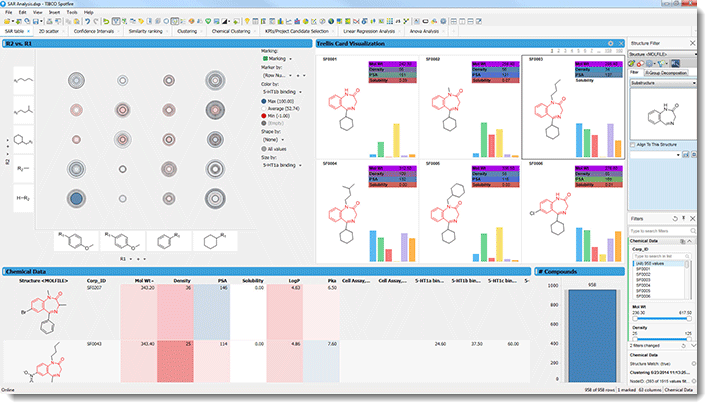
Visualizations
- Chemically-intelligent scatter plots, line charts, pie charts, summary statistics table, bar charts and histograms.
- Drag-and-drop to create and modify visualizations and analyses on-the-fly.
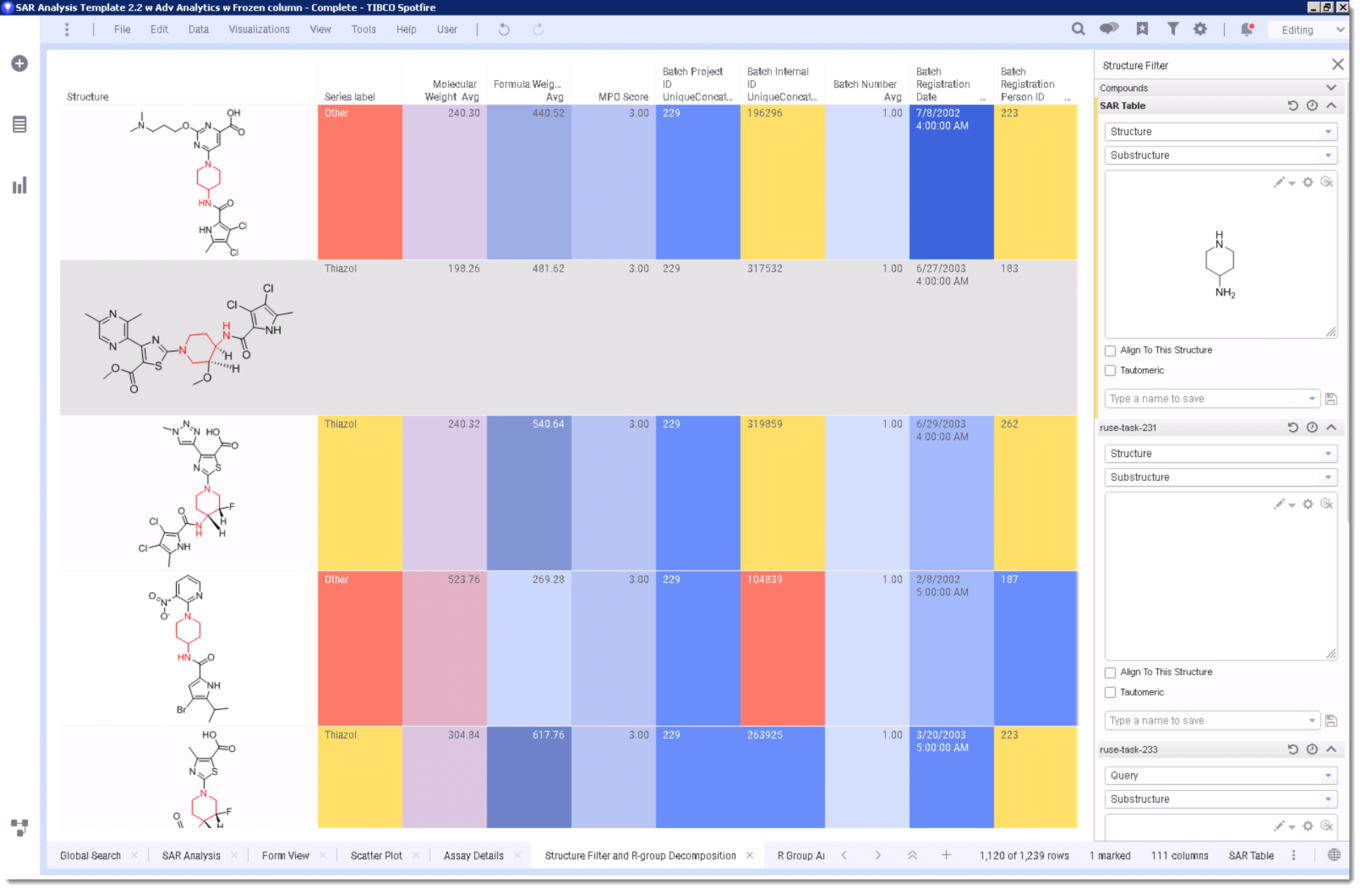
Chemical structure viewing and filtering
- View structures from molfiles, SMILES, CDX (ChemDraw), or chemistry databases and filter using trusted similarity, substructure and tautomer perception algorithms.
- Import and export SDfiles and ChemDraw for Excel documents.
- Align all structures to a chosen scaffold.
- Tag data based on chemical attributes for further classification and analysis.
R-Group Decomposition
- Define a common scaffold in a series of related structures and Lead Discovery will analyze and display all the attached R-groups.
- Scientists can discern favorable substitution patterns and preferred substituents to aid in lead optimization.
Auto-apply saved filters and R-group analyses
Rapid access to the latest hit sets
Resources
Lead Discovery Premium combines the analytics power of Spotfire® with the chemical smarts Revvity Signals is known for, then adds powerful biological sequence intelligence to create the premier platform for scientific visualization and analysis.
The guided workflows empower you with the ability to find and assemble any data you want to answer any scientific question – from drug discovery to materials science experiments – in minutes rather than days, independent of your IT department.